Resilience Science: Change the way you think, change the way you work
Robust research and data to help you see how resilience affects your performance across your organisation and see what you can change to gain a new dynamism.
Those with the highest level of resilience fill only 65% of their time doing stuff.
REVEAL DATA
Your resilience is your ability to adapt, or your capacity for change.
REVEAL DATA
Those with the highest resilience don’t experience stress.
REVEAL DATA
You can double your capacity by investing in your resilience.
REVEAL DATA
Those with the highest level of resilience fill only 65% of their time doing stuff.
Yes, only 65%! The remainder is spent on their Adaptive Capacity. This changes in times of extreme pressure, when we dedicate capacity to getting through the tumultuous time. However, they come back down to this steady level of 65% following these periods, returning to investing in perspective, refreshing themselves, horizon scanning and smoothing out bumps before they become issues.
Your resilience is your ability to adapt, or your capacity for change.
Whilst many will describe resilience as coping or bouncing back, our research has consistently demonstrated that it is the strategic capability of adapting to change. Organisational resilience is the measure of how much change the workforce can absorb successfully without being hijacked. Without investment into this adaptability, the performance is likely to be caught in what we call ‘the mediocrity loop’.
Those with the highest resilience don’t experience stress.
Resilience is a buffer to stress. Therefore, by concentrating on your resilience enablers you can improve your reaction to stress. Josh Bersin’s work on Covid-19 Business Resilience shows that organisations who had the most resilient pandemic responses were 4.5x more likely to effectively respond to change, 3.9x more likely to retain customers and 4.5x more likely to outperform the competition.
You can double your capacity by investing in your resilience.
Most good performers within organisations have ‘Bounce Back’ levels of resilience. In Bounce Back, your energy is going up and down. You lose a lot of energy in both the ‘down’ times and also in managing the variability. Investing in resilience will flip these ‘down’ losses and revitalise your energy, which will lead to a potential doubling of your capacity.
RESILIENCE DYNAMIC
DATA INSIGHTS
We collect quantitative data from our Resilience Dynamic® Indicator and Resilience Dynamic® Questionnaire, as well as qualitative insights from our client work and research.
Benchmark your organisation against our data insights.
We provide generic data insights to understand differences across social and sectoral groups. These insights into resilience science will allow you and your organisation to sense-check your own data and the kinds of actions you can take to boost and improve resilience across your workforce.
For example, we have Resilience Dynamic® Indicator responses from 191 NHS workers. Their highest resilience drivers are their health, stability and ability to respond well to change. In contrast, their lowest scores are for tiredness, stress and ability to create extra capacity in their lives.


We track age and gender influences on resilience.
Age and gender matter to resilience, and they are factors which need to matter in your organisation. 45+ year olds fare better across the board, so leveraging across your organisation is a good idea. Within your gender groups, you need to attend specifically to women who self-report lower resilience scores, with the largest differences being tiredness, stress, and balance in life.
Seeing Resilience Data
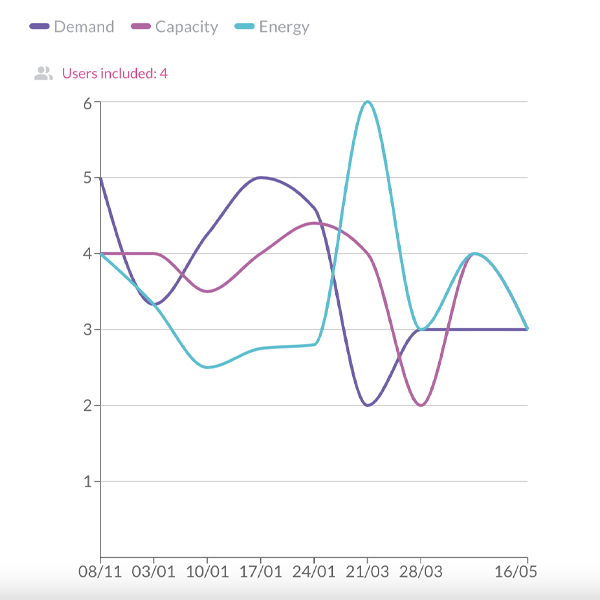
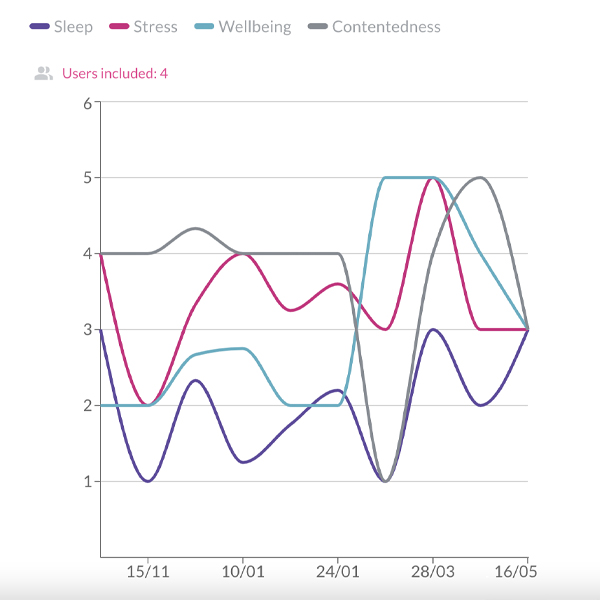
We provide useful insights from your data through our team services. Below you can see a sample set of insights from a 44-participant client case study.
Understand Demand versus Capacity and Energy Levels Across Your Organisation
Understanding in real-time the optimum balance of resilience demand versus capacity is a game changer for ensuring you optimise both performance and wellbeing, as they are so integral to one another. Take action where there are hot spots, misalignment or health-related ‘red flags’.
Average Organisational Resilience Demands
3.95
Average Organisational Resilience Capacity
3.93
Average Organisational
Energy
3.59
Organisational
Demand
-0.02
See an aggregated view of how your team is tracking their demand, capacity, energy and more on the Management Dashboard.
OUR RESEARCH METHOD
The Resilience Dynamic has been researching resilience since 2007.
OUR Resilience Dynamic®
Research Model
Since 2014, the research has shifted the enquiry into team and organisational resilience, holding the same core research questions, now focused on collective resilience.
Our initial research aimed to answer two core questions; ‘what is resilience?’ and ‘how can you build resilience?’. The prime research method we adopt, Action Enquiry, enables a co-enquiry with our research clients. This allows both the client and researcher to discover the team’s resilience together.
We use Grounded Theory and Constructivist Grounded Theory methods, both building from multiple sources of data and coding according to common themes and patterns that arise.
The process of coding the data into themes is repeated again and again until there is what is known as ‘saturation‘. At this point, whatever angle you come at, the data shows the same pattern or insight.
The method allows for multiple data sources in different formats and ensures a fresh perspective independent of any pre-determined hypothesis or bias.
Resilience Science FAQs
Are our research insights based on individual or organisational resilience?
From a data point of view, our quantitative Resilience® Dynamic Dashboard data is taken from our two self-assessment services, which build from individual responses. We then aggregate these so that team leaders, managers and leaders can see their teams and whole organisational data. Note since we have the Resilience Dynamic Indicator service off our website, we do get 000’s of data points which gives us a general view across the population. Finally, it’s worth mentioning that our data insights can also come from ‘deep dives’ in one organisation, which are added anonymously into our overall database.
Is there an easy way to read about what resilience is and how to apply it?
Yes indeed! Please read ‘The Resilience Dynamic’ book, available worldwide through Amazon here.
Where can I read more about the Resilience Dynamic research and data insights?
Read more about our extensive research in the research section on our resources page. These include our original 2009 research paper ‘Resilience – Personal and Organisational’, ‘Introduction to the Resilience Dynamic’ – where you can see a breakdown of each resilience level, and our 2021 Whitepaper ‘How to Build a Resilient Organisation’.
How can I ensure I am receiving the most useful resilience data for my organisation?
We know that the core data collected in the Resilience Dynamic Dashboard service is the key data you will need for enabling resilience across your teams. On top of that, we offer the option to set up your own demographic categories to drive your own team and organisational views.
How can I use the data insights gained from the Resilience Dynamic services to boost resilience in my team/organisation?
We base all our thinking on the principles of the See-Understand-Optimise It framework. By helping your team SEE their own individual and team views, you help them unlock insight into where to focus to boost resilience. From the individual and team reports, people see the areas to focus on and use the Resilience Toolkit to help address them.
What research methods do you use?
Our original methods were the qualitative methods of Grounded Theory and Constructivist Grounded Theory. Now, with both qualitative and quantitative data sets, we use a mix. We continue to hold our core research questions of ‘What is resilience’ and ‘How do you built it’. With our quantitative data, we issue tracking information against our whole data sample, giving insight into population shifts. This has been extremely useful during the pandemic.
Participate in our team resilience research and discover your team’s resilience together.


